Definitions of indices and methods
Incidence stands for number of all newly diagnosed cases of a disease that develop in a defined population in one calendar year. The incidence consider the number of cases of disease not the number of patients, therefore the same patient can contribute to the incidence number more than one case of disease, if he/she is diagnosed with more than one different cancers in the same year. New primary cancers of the same histology in paired organs, e. g. on the left and right breast, are not comprised in the incidence figures, neither are any new cancers of the same histology appearing in the same organ, e.g. multiple lesions of the colon.
Data source on incidence is Cancer Registry of Republic of Slovenia database. Web page SLORA includes data on patients, diagnosed from the year 1961, with permanent residence in Slovenia at the time of diagnosis.
Mortality stands for absolute number of all patients who died because of certain disease in a defined population in one calendar year.
Data on mortality are collected and provided for software SLORA by the National Institute of Public health (NIPH). Software SLORA includes data on patients, who died of cancer in 1985 and after. Minor deviations (few cases annually) between official mortality and SLORA output happen for those three reasons:
- Death Certificates for the residents of Republic of Slovenia who die abroad arrive only after the conclusion of data analyses at NIPH, therefore they are included in the following year mortality. On the contrary SLORA software shows the number of dead patient in the year when they actually die.
- Death causes for the period 1985–1996 are officially arranged by the ICD–9 (International Classification of Diseases) and later on by the ICD–10. SLORA considers ICD-10 for all years. Minor deviations between official reports and SLORA output can appear due to conversion between the 9th and 10th revision of ICD at the Cancer Registry of Slovenia for the period 1985-1996.
- Official reports on mortality include all persons who correspond to the official definitions of Slovenian population, which has been valid for a certain period of time. Software SLORA includes all persons with permanent residence in Republic of Slovenia at the time of death, regardless to official definition.
Prevalence is the number of all patients with specific disease that are alive on a given date (usually the last day of the year). Prevalence counts every cancer case, even though the same patient is diagnosed with more than one cancer. But the prevalence of all sites of cancer includes the same patient only once. Thus the sum of prevalences of individual sites of cancer is always higher than the prevalence of all sites of cancer. According to the time of diagnose we distinguish lifetime prevalence and partial prevalence.
Data source on prevalence is Cancer Registry of Republic of Slovenia database. Web portal SLORA includes data on patients, diagnosed from the year 1961, with permanent residence in Slovenia at the time of diagnosis .
In groups of patients, the survival represents the proportion of patients still alive after a selected period of time from diagnosis. Survival of cancer patients is generally observed after one, three, five and ten years from diagnosis. This survival is called observed survival and relative cancer survival.
In clinical studies, where our interest is generally focused on deaths due to a particular disease, in the analysis all deaths due to other causes are treated as censored (the so-called cause-specific survival. Such approach would seem reasonable also in population studies, however, in practice it turns out that the number of patients entered into such studies is too large to allow the exact cause of death to be established for each individual patient; the data on official causes of death that are collected by the Institute of Public Health of the Republic of Slovenia, are often insufficiently accurate for such purposes. Therefore, and because of the incomparability of the observed survival between different populations, currently relative survival rather than observed one is used in population studies. The calculation of relative survival does not require information on the cause of death, but nevertheless, the method yields a result that is a good approximation of patients' survival in the case that the observed cancer would be considered as the only cause of death.
Population-based survival of cancer patients, as shown by cancer registries, is a complex indicator, which reflects patients' characteristics as well as the organization, accessibility, quality and efficiency of healthcare system; generally, it greatly differs from the survival of patient groups with a particular disease, treated in individual hospitals, as commonly presented by clinicians.
The population survival is influenced e.g. by stage of the disease at diagnosis, which depends on the time from first suspicious symptoms to diagnosis, this time being the shorter, the better is public awareness about which health problems require medical attention, the more skilled is the physician who first sees the patient and considers the possibility of a severe illness, the greater the accessibility of diagnostic procedures and the shorter the waiting time. The availability of screening programs for those cancers in which the benefit of such programs is clearly demonstrated (colorectal cancers: in Slovenia programme SVIT, breast cancer: in Slovenia programme DORA, cervix cancer: in Slovenia programme ZORA) further improves the chances of cure or at least better survival. After the diagnosis has been established, treatment success depends on the type of cancer, patient's characteristics (age, concomitant diseases, general performance status), as well as on the competence of health team, i.e. on the experience and skills of the oncological surgeon and all those involved in the multidisciplinary treatment approach; sometimes, in the institutions where the treatment is started, no such team is available at all From the public healthcare point of view, population-based survival is less influenced by the availability of the latest and most expensive drugs.
SLORA software presents the observed and relative cancer survival.
Data source on survival is Cancer Registry of Republic of Slovenia database. Web portal SLORA includes data on patients, diagnosed from the year 1961, with permanent residence in Slovenia at the time of diagnosis.
Crude rate tells the number of new cases of disease or the number of deceased from this disease, calculated per 100.000 population.
Crude rate (GS) is defined as number of new cases in a specified time period (N), divided by the number of persons, living in observed population in the middle of this time interval (P). Data source on population is Statistical Office of the Republic of Slovenia. Crude rates in portal SLORA are expressed per 100.000 population: 
In case of gender specific cancer site, the crude rate is not delivered in outputs for both genders together.
Age-standardized rate is a theoretical incidence rate assuming that the age structure in the observed population is the same as in the standard population – it tells the crude rate in observed population in case if it´s age structure is the same as in standard population. Age-standardized rate is used when analyzing the incidence/mortality within longer time of period (if the age structure of population changes in time) or comparing the incidence/mortality between populations with different age structure.
There are few methods to calculate age-standardized rates. Direct method of age standardization is being used in web portal SLORA. In this case age-standardized rates (ASR) are calculated by formula: 
In case of gender specific cancer site, the age-standardized rate is not delivered in outputs for both genders together.
When standardizing by age in epidemiological analyses we use one of those three standard populations:
- World standard population (Segi 1961) – in international comparisons, when countries from all over the world are included;
- European standard population (Doll 1976) – in international comparisons, when countries from Europe are included;
- Slovenian standard population (Census 2002) - in comparisons regarding only Slovenia.
This table shows population structure in each standard:
| Age group | World standard | European standard | Slovenian standard |
| 0-4 years | 12,000 | 8,000 | 4,489 |
| 5-9 years | 10,000 | 7,000 | 4,893 |
| 10-14 years | 9,000 | 7,000 | 5,791 |
| 15-19 years | 9,000 | 7,000 | 6,567 |
| 20-24 years | 8,000 | 7,000 | 7,535 |
| 25-29 years | 8,000 | 7,000 | 7,494 |
| 30-34 years | 6,000 | 7,000 | 7,190 |
| 35-39 years | 6,000 | 7,000 | 7,827 |
| 40-44 years | 6,000 | 7,000 | 7,746 |
| 45-49 years | 6,000 | 7,000 | 8,089 |
| 50-54 years | 5,000 | 7,000 | 7,151 |
| 55-59 years | 4,000 | 6,000 | 5,354 |
| 60-64 years | 4,000 | 5,000 | 5,240 |
| 65-69 years | 3,000 | 4,000 | 4,804 |
| 70-74 years | 2,000 | 3,000 | 4,214 |
| 75-79 years | 1,000 | 2,000 | 3,019 |
| 80+ years | 1,000 | 2,000 | 2,596 |
Cancer Registry of Republic of Slovenia is restricted by technology of data collection, because there are many data sources. To conclude annual data collection, data analyze and data preparation with as complete results as possible we need time of 2 to 3 years, as it is also in other countries.
Web portal SLORA enables output of estimation of incidence in current calendar year. Estimation is calculated by the Dyba and Hakulinen method. This model includes patients according to the period of diagnosis and their age at diagnosis for the last ten registered years.
Lifetime prevalence is defined as the number of all persons ever diagnosed with cancer and being alive at specific time date (usually the last day of calendar year). If the person is diagnosed with more than one cancer in his/her lifetime, we count each cancer diagnose in lifetime prevalence, but in prevalence of all cancer sites together we count each person only once.
Partial prevalence is the number of all cancer patients, being alive at specific date (usually the last day of calendar year) and being diagnosed with cancer within a defined period of time before the date of calculation. One year partial prevalence includes patients, diagnosed with cancer one year before the date of calculation, patients included in 1-4 years prevalence were diagnosed within one and five years before calculation, ect. If the person is diagnosed with more than one cancer in specific time period we count each cancer diagnose in partial prevalence, but in partial prevalence of all cancer sites together we count each person only once.
The partial prevalences in cancer are important, as they reflect the number of cancer cases in different course of disease, e.g. the one-year prevalence includes patients during their primary treatment, 1-4 years prevalence those requiring regular clinical follow-up, while 5-9 and especially 10 and more years prevalence includes predominantly those considered cured from cancer.
The observed survival stands the proportion of patients still alive after a selected period of time from diagnosis regardless of their cause of death. For the calculation of observed survival in SLORA software the Kaplan-Meier's method is applied. In this method the survival probability is calculated at each death/censoring event. The basic unit used is a day.
A plot of the Kaplan–Meier estimate of the survival function is a series of horizontal steps of declining magnitude where the value of the survival function between two successive deaths is assumed to be constant.
Relative survival is a ratio between the observed and the expected survival, i.e. the survival expected with respect to gender and age in certain time period in the whole population the patients come from. The expected survival is calculated from general mortality data, published routinely in the form of mortality tables for an individual country within the framework of its vital statistics. Slovenian complete yearly life tables were used for calculation in SLORA software.
The Hakulinen or complete method of relative survival was applied in SLORA software. In this method the patients followed up for a shorter period of time are considered in the calculation only for the time when they were actually followed. Thus, a group diagnosed three years before the completion of study, contributes to one- and three-year complete relative survival but not also to five-year survival.
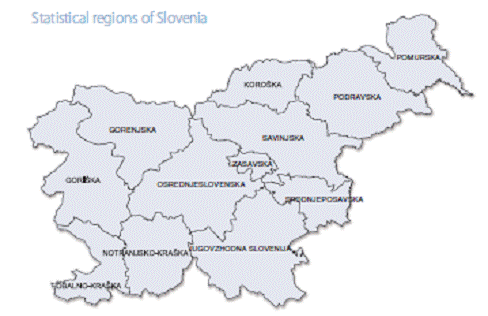
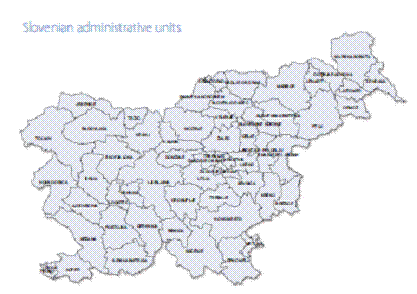
SLORA geographical output classifies patients to official administrative units – in 2000 a new official division of Slovenian territory at eleven levels was introduced – according to their permanent residence at the time of diagnose or death. Third (12 statistical units) and fourth level (58 administrative units) are used. Before year 1990 the populations of Pesnica and Ruše administrative units were united in administrative unit Maribor. Those three administrative units are always drawn as one unit in maps, with the value being the average of all three.


