
User Guide
The SLORA portal allows users to independently prepare and display data on the incidence, mortality and prevalence of cancer patients in Slovenia. Data preparation is organised by epidemiological indicator (Incidence, Mortality, Prevalence). The user interface is the same for all three, but the content differs. Depending on the type of indicator, various parameters are available for preparing and displaying data. These instructions describe the parameters for incidence, which offers the widest range of options.
The data to be displayed are selected on the left side (in the toolbar), while the results are displayed on the right.
Descriptions and definitions of indicators and individual parameters are compiled in the Glossary. You can also access it by clicking on “Methodology” when viewing a graph.
Specifying Data for Display
The left side (in the toolbar), dedicated to specifying data for display, is divided into three sections:
In the first section (A), select the measure you want to display. If you select “number of cases”, the number of cases will be plotted on the y-axis of the graph, and the values in the table will also represent the number of cases. Select the measure from the drop-down, the options for Incidence are “number of cases”, “crude incidence rate”, “age-standardised incidence rate”, and “estimation”. The choice of this measure will also determine the available options in sections B and C.
In the second section (B), select the two parameters by which you want to display the data. Select both parameters from the corresponding drop-down menus; additional options for specifying values will appear below the menu. The first parameter (B1) determines the categories in the legend on the graph; in the table, these correspond to the row labels. The second parameter (B2) determines the categories that appear on the x-axis of the graph; in the table, these correspond to the column labels. If you select a specific parameter for B1, you cannot select that same parameter for B2. The parameters available for incidence (number of cases) are “cancer site”, “stage”, “sex”, “age”, “geographical unit”, and “time period”. “Time period” is available only for B2; the others are available for both.
In the third section (C), you can further restrict the remaining parameters – that is, those not selected in section B. The options for these restrictions are similar to those for setting the main parameters, but they are limited to choices that do not affect the layout of the display, only the magnitude of the displayed value. For example, if you select two regions in the restrictions, you will not receive data for each region separately, but rather a combined value for both regions. When you change your selections in section B, the restriction options in section C also change.
Click the “Show results” button to generate the data. The data display remains as it was at the time of the last click on “Show results”, even if you change your selections in the parameters afterwards. To recalculate, you must click the button again.
![[Translate to English:] shema izbirnega menija za Portal SLORA, označeni deli A, B in C](/fileadmin/_processed_/c/f/csm_up_navodila_01_9aa92b1f5d.png)
Parameters Options
Cancer Site
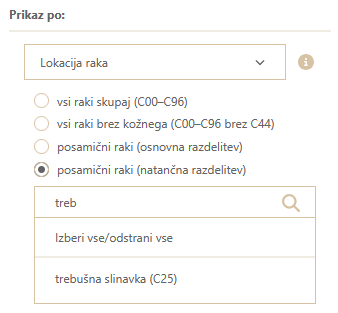
For the cancer site, specify the ICD-10 codes for which you want to display data. There are four basic options available:
- two that combine all cancers: the first includes all cancers from C00 to C96, while the second includes all cancers sites except C44—non-melanoma skin cancer, and
- two that allow the selection of individual cancer sites: the basic list and the detailed list. In the basic breakdown, cancers are grouped, while in the detailed breakdown it is possible to select each cancer site separately (with a few exceptions).
The codes included in each selection are listed in parentheses next to the name of the cancer site. When you select the “Individual cancers” option, a list of cancer sites appears below. By default, all cancers are selected, but you can change your selection by clicking the “Select all/Remove all” button and then choosing only the desired options. You can also search for cancers using the search box (shown in the image). The selected cancers are displayed below the list. To remove a specific cancer from your selection, click on it in the list or click the “x” next to the cancer’s name below the list.
Stage
For “Stage”, you can select one of the displayed options. Selecting “all stages” displays limited, regionally advanced, metastatic, and unknown stages separately, as well as non-malignant cases and cancer cases for which the stage is not determined (see the Glossary for more information). Other selections display only the chosen category.
For certain combinations of cancer type and stage (e.g. leukaemias and the “metastatic” stage), an empty graph is displayed, or the table indicates that a value for this combination does not exist or is not calculated. In such cases, a note is also displayed.
Sex
There are four display options for sex. Selecting “All” shows values for both sexes combined; “M:F” shows values separately for men and women; and “Males” and “Females” show values for the selected sex.
For certain combinations of cancer type and sex (for example, prostate cancer with the “Females” selection), an empty graph is shown, or the table indicates that values for this combination do not exist or are not calculated. In such cases, a note is also displayed.
Age
Age data are shown in five-year age groups. The default selection displays values for all age groups, but you can limit the range to a smaller number of groups. Because the display is determined by the interval, only consecutive age groups can be shown, not arbitrary combinations of groups.
If you want the total value for a specific age range (for example, 0–19 years), select the display based on two other parameters and limit the age to the specified range (Part C).
Geographic Unit
For the geographic unit, you can choose to view data by statistical regions or administrative units. Once you select one of these options, a list appears below from which you can select the desired geographic units.
Time Period
You can specify the time period so that values are displayed for individual years (option: By Year) or for multiple years combined (option: Total Period). When selecting By Year, two additional options are available: Range of Years and Individual Years. For Range of Years, a slider appears below that allows you to set the interval. Data will be displayed for each year separately within the selected interval, including the boundary years. When selecting Individual Years, you can choose the specific years for which you want to view values, in the same way as when selecting individual categories or spatial units. If you select Total Period, a slider is available to set the time range. The total value for the entire selected period is then displayed.
Data Display
The data is shown in both graph and table formats – you can switch between them by clicking the “Figure/Table” tab.
By default, the figure appears first, except for combinations of selections where no values can be displayed or where the result is a single value. The display used in the previous calculation (figure or table) is also taken into account.
Graphical Display
The figure’s format depends on the selected display parameters (bar chart/histogram, line chart, etc.). The selected measure is used as the title, and a summary of the selected parameters and constraints is shown below it. The y-axis shows the values of the selected measure, while the x-axis shows the values determined by parameter B2. The legend is displayed below the graph, and its categories are determined by parameter B1.
The figure is partially interactive. If you hover your mouse over a specific element of the figure, it is highlighted and a pop-up window with more detailed information appears.
Saving Figures
You can export the figure you have created and save it to your computer as an image by clicking the “Export image” option to the upper right of the chart. The image format is PNG. You can also export the data used to create the image in CSV format.
Tabular View
The tabular view is available under the “Table” tab. Columns are defined by parameter B2, and rows by parameter B1. Clicking an individual value highlights it with a box, which can make it easier to compare values.
Saving Tables
By clicking “Export” in the upper-right corner, you can save the table contents and selected parameters in XLSX format.